
I told myself I’d be starting small and I meant it – we’re starting with a MiniProject.
So, introducing Equation to Graph.txt (better name pending – “ASCII Graph.txt“?).
The initial premise is very simple. A user provides a two-dimensional mathematical equation as a string, and this little script will spit out a .txt file that draws the graph of that equation using only ASCII characters.
Starting Out
I had this idea while driving back to Cambridge after demoing a new product I’ve been working on at work. While my colleague was driving, I was trying to come up with ideas for software projects. I didn’t expect this idea to push boundaries in my knowledge when it came to software design and programming, but I thought it made for a fun task and that it would be the perfect thing to sink just a couple of hours into.
I spent the next half hour of the drive thinking about how I could create the simple script and making notes on my phone as I tried to plan out the program without getting too car-sick. Resulting in the notes below:

You can kind of see my thought-process going through all the processes needed by the script, then adding detail on how I might achieve them. You can also see that where things are potentially difficult I tend to either characterise them as “HARD” (aka figure it out later and work around for now) or delve into initial research (in which you can see a fair bit of my naivety).
In particular, you can see my difficulty figuring out how to parse user text such that it doesn’t need to be reparsed every time the math it represents needs to be done. One could tokenise it somehow to allow the tokens to be used to determine what math to do, or dynamically define a function from the string and call that function throughout, or use something like Python’s eval() function (which I discovered in the quick research done on the road) and store the function as a string.
I decided to go with the eval()/exec() option in Python and started some research on how to use it safely. It’s immediately obvious that there are serious security implications when using eval or exec, which are important to address even in toy projects such as this one. We could attempt to blacklist certain functions, or whitelist the one’s we’re expecting, or sanitise the user’s input directly but it’s clearly difficult to avoid clever attacks. This blog post that I found while on the road explores this in a little more depth (I found it quite interesting too). Considering that we don’t need the full functionality of python to do the math of plotting a graph, however, I came across the ASTEVAL package (a “minimalistic evaluator of python expression using ast module” with an “emphasis … on mathematical expressions”) and found it to be a pretty good replacement for eval for this project’s needs – one that greatly decreases the amount of input sanitisation I need to handle myself.
EDIT: Since starting work on my Dice Distribution Generator app, I’ve come across postfix notation and the Shunting Yard algorithm (thank you, Dijkstra!). This would clearly be a much better way to parse user input than my rather hacky use of ASTEVAL. It’s a shame I didn’t happen across it while doing my initial research for this project, but you live and learn, I guess!
Getting On With It
So a few days later I sat down to put something together, and a couple of hours later I had a very messy but working script. When run directly, the script requests the following info from the user:
- a mathematical statement (the RHS of a “y=” equation, with x as the variable),
- the range for each axis,
- the size (in characters) of the graph to plot.
It then creates an array of characters representing the equation based upon these inputs (or default inputs where user input can’t be parsed or is out of the acceptable range) and prints it. The user is then asked for a location and filename for the text file, after which the script generates a text file from its array.
For the most part, once I’d got used to using the ASTEVAL package (in particular reading and writing from variables held within the asteval object), this was all pretty trivial to achieve. Rendering the graph essentially came down to comparing the y-values at the left, centre and right of each column to choose the character, and then placing it on the appropriate row.
A little trial and error was all that was needed to get this working well.
Some examples…
Here’s an example, running the python script directly.
And here’s some outputs!
abs(3x) 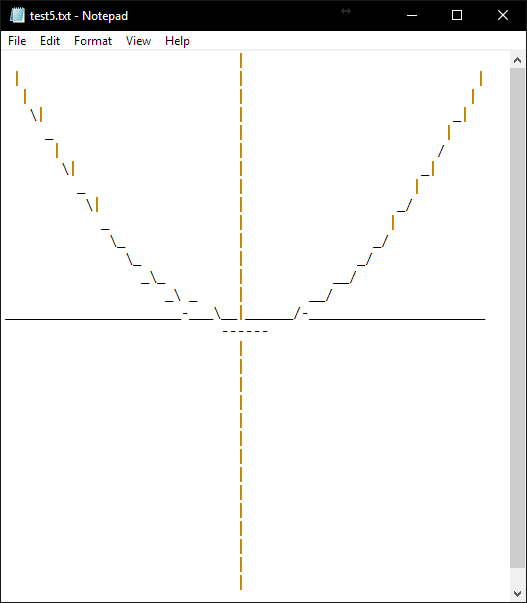
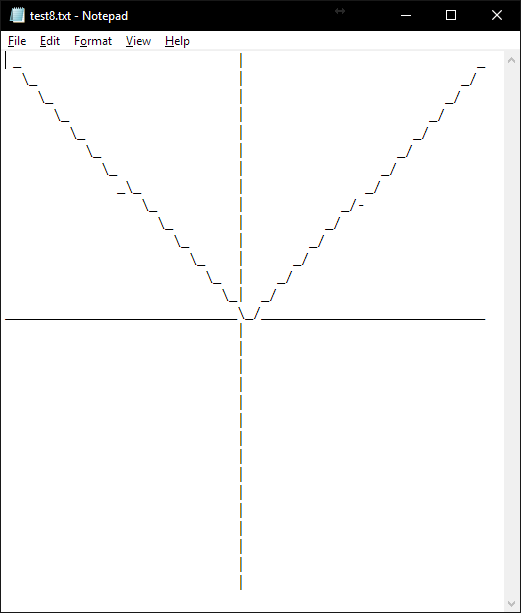
x^2 
x^3 – 10x^2 +5x – 20 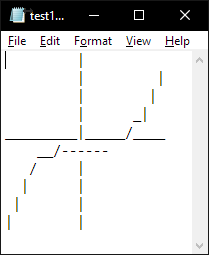
x^3 (shrunk to just 10 rows!) 
abs(x^3 – 10x^2 + 5x + 400) 
sin(x+3.14)
Conclusions
Looking at the outputs above, you can see a few issues.
- resolution limits when plotting small graphs
- some general jankyness – especially on curved lines
- some gaps on near-vertical lines
Overall, I’m pretty happy with the result so far, and especially pleased with how well larger plots work visually considering the obvious limitations of ‘rendering’ a graph in this way.
So, I think it’s worth cleaning up the code to make the toy a little more presentable and filling some of the gaps. I’ll update when I get around to it.
Things to do:
Rewrite as a class (better for use as an included script) to take from a proof of concept to a usable module- Expand parsing abilities so that user doesn’t have to use exact Python notation (allow ^ for **, 3x for 3*x)
- EDIT: As mentioned above, I’ve since discovered the Shunting Yard algorithm and postfix notation. I should rewrite this script to use it instead of asteval.
Use main() as a demo script to show users how to use the module when the script’s __name__ is “__main__”- Catch div0 errors (I’d noted to do this from the start but forgot – oops!)
- Add axis labels and graph title
Possible extensions:
- Automatically determine interesting scale at which to render (by finding interesting points and plotting to include them all? find turning points and show them? Find y intercept? Find asymptotes?)
- Allow multiple lines on one plot (using “x”, “X”, “L”, “J”, “<” and “>” chars where lines cross.
- A friend recommended a new and interesting methodology – plot the graph properly and run OCR on the image to generate the ASCII plot – I’m not entirely sure that the results would be great, but I think it would be a great way to introduce myself to OCR. You can find his very impressive project blog here, by the way.
