
I’ve only just found time to write this up, but I actually worked on this short project in early January.
I’ve been meaning to try to write an android app for quite a while, and as the year started I found myself motivated to just get on with one. I had a small idea that would give me the chance to get used to the development environment and a bit of Java before I move on to any of my more complicated app ideas (see “GetTogether”).
Aims
Android
– Figure out Android Studio
– Make something in Java that works (I don’t feel the need to learn the ins and outs of Java right now, but getting a bit of experience never hurts)
– Try some Android Libraries
– Make a functioning, ‘useful’ Android app and put it on the play store
General
– Figure out parsing mathematical equations
The Idea
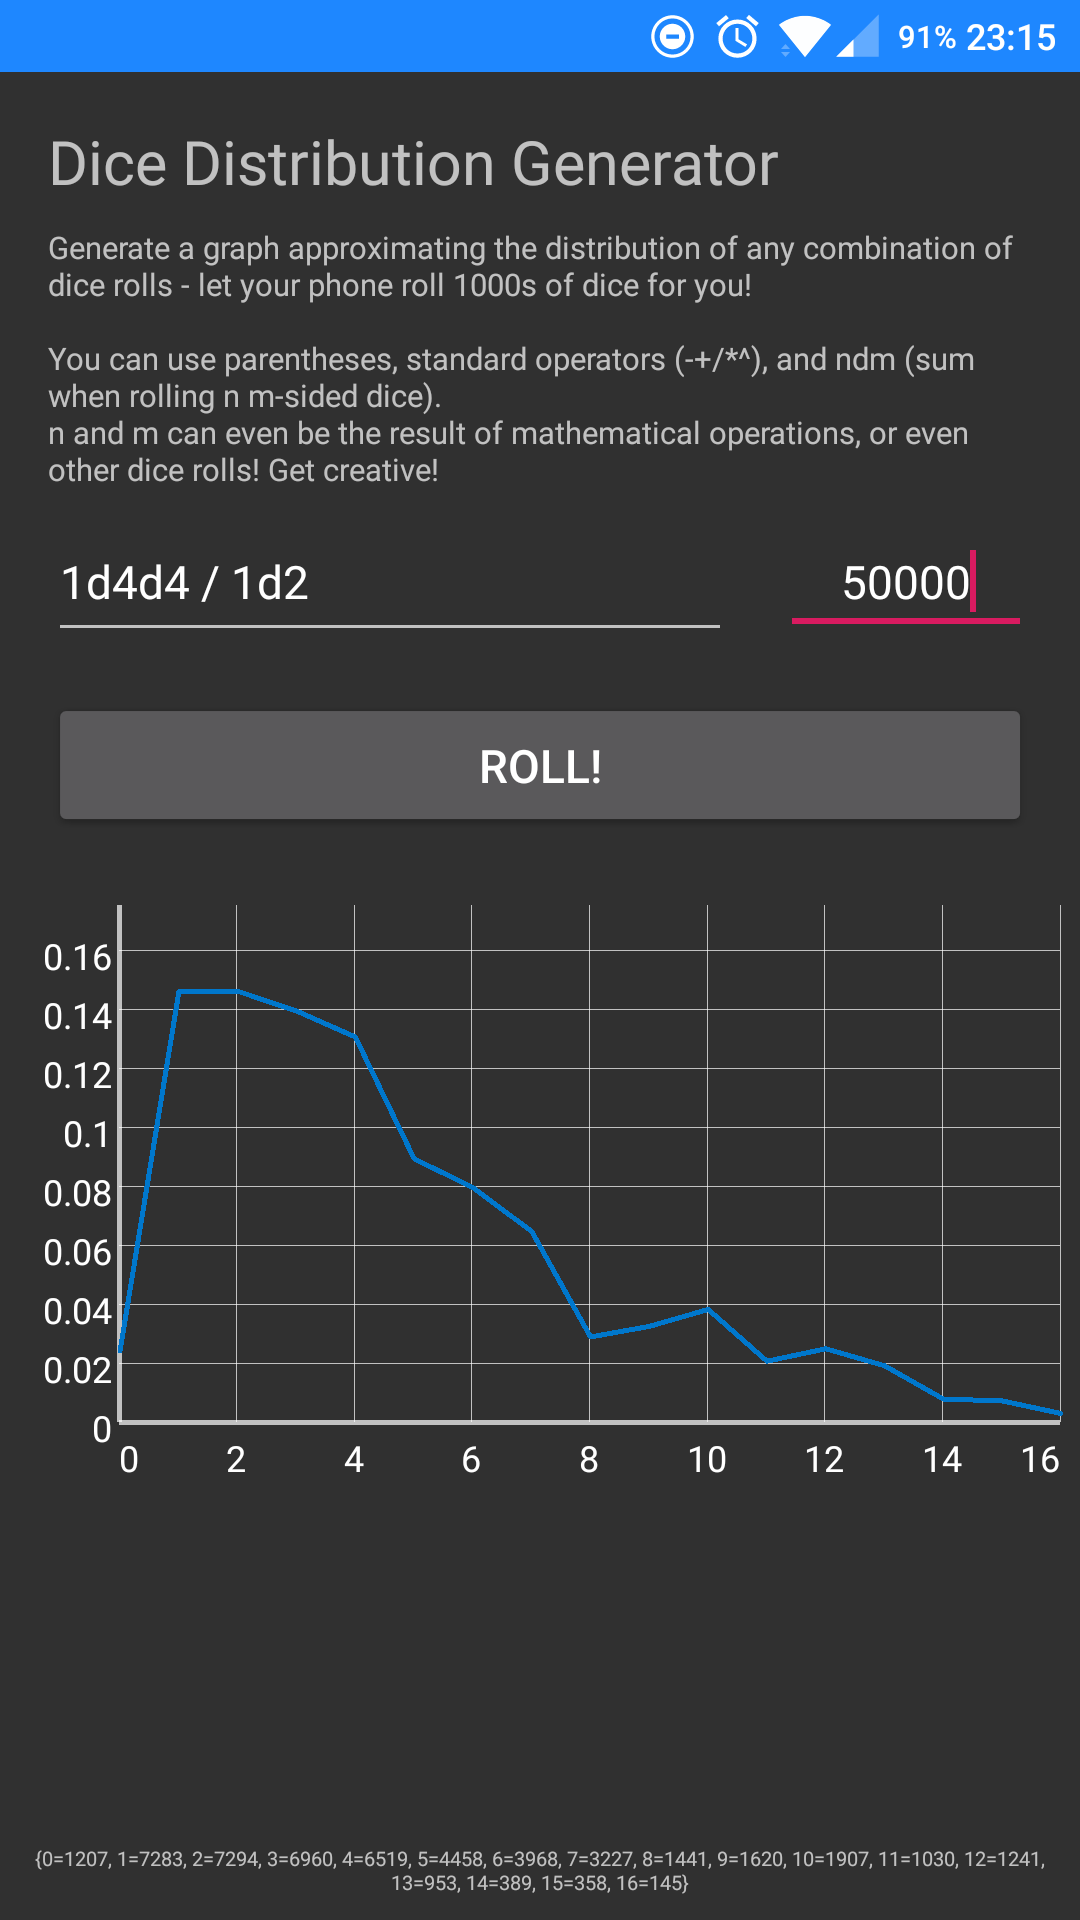
A simple app that allows users to specify any combination of dice rolls and get an estimation of the distribution of results ‘by experimentation’ (i.e. as if they rolled the dice 100s of times themselves and tallied the results). I see it as a nifty tool for tabletop game design, or maybe for education.
Oh and before I go much further, here it is. (Coming to Google Play shortly).
Why Java?
I decided to write the app in plain old Java, rather than using Kotlin or experimenting with React Native. I don’t have any experience with any of these languages / frameworks so I went with the idea of starting where Android started. For now, I think that if I end up creating a lot of apps, then I’ll explore Kotlin, and if I want to try some webdev then I’ll consider React Native.
I should add, using Android Studio felt like a real treat to me. It’s simple and quick to pick up (I quickly ran through the Build your first app tutorial to get me going), integrates nicely with Git, and the GUI for creating layout XML resource files is really cool. Proper auto-completing and other helpful tools are great to have too. It’s really different to what I’m used to when using Eclipse for Python projects or Notepad++ for embedded C++ stuff. The environment also feels like a big step up from LabVIEW (which I’ve used to put UIs together in the past).
The Algorithm
My previous Python MiniProject (generating ASCII Graphs) left a bad taste in my mouth over the way I dealt with parsing user-input mathematical expressions – and I knew that I needed to do more research. Parsing user instructions is by no means a unique issue and I knew that for mathematical expressions there had to be an existing algorithmic approach to tokenizing the math as a list of instructions to be carried out in a set order. Enter the Shunting Yard Algorithm. It’s said that the best way to learn is to teach, so I’m going to do my best to explain the algorithm here.
For the Shunting Yard algorithm to make any sense and be useful I need to first explain postfix notation. It’s a pretty nifty way of dealing with the difficulty that reading human written math poses for computers – or at least I thought so when I first came across it.
The problem with mathematical expressions is that there are quite complex rules for the way in which we should interpret the numbers and symbols depending on their context: we use this funky combination of precedence of operations and left to right precedence that we remember as BIDMAS (the notation style is actually called infix though). It’s simple enough for humans to follow once we’ve been taught it, but Computers, on the other hand, much prefer a list of numbers in the order in which they’ll be used and an accompanying list of operations in the order in which they’ll be done. Postfix notation represents those lists in a string format, representing mathematical expressions in a purely left to right manner without a need for brackets or rules of precedence to lump operations together.
In postfix notation, 3 + 5 becomes 3 5 +
3 + 5 * 8 becomes 3 5 8 * +
5*8+3 becomes 5 8 * 3 +
and (3 + 5) * 8 becomes 3 5 + 8 *
Extending this: (3+5)*8/14^(2+1) becomes 3 5 + 8 * 14 2 1 + ^ /
You might be able to see how that works by inspection. If not, a diagram showing reading postfix notation step by step might help.

In the above example, we read left to right. If the symbol we are looking at is a number (or variable) we add it to the top of a stack of numbers to operate on. If it’s an operator, we perform the relevant operation on the latest numbers in the stack and add the result onto the stack. We continue doing this until we run out of symbols and are left with our result as the only item in the stack!
Here’s an example including dice rolls (detailing only the dice bits for clarity).

All I’ve had to do is add d as a new operator that generates random integers a number of times and sums them. In the same way we could add min/max, trig functions, the abs function, %, or anything else we might need.
This is really easy to get a computer to do, so it’s a really neat way of storing an expression if the computer is going to evaluate it multiple times (as it does when doing thousands of trials to generate the dice result distributions for the app).
The Shunting Yard Algorithm, in turn, is just a simple algorithm that converts normal, human math (infix) into postfix notation using a list of operation precedences, and a function for each operator. It’s explained really well on its Wikipedia page, so I won’t list out the steps here.
I based my implementation in Java on one provided by Rosetta Code, and expanded it simply to understand the 2d6 style of notation commonly used to describe combination dice rolls. (You can also stack dice rolls: 1d20d6 means roll a 20 sided die, and then add up the results of rolling that many 6 sided dice – these kinds of stacked combinations allow much more interesting result distributions to be created.)
Drawing Graphs
I used the GraphView library to generate graphs. It’s pretty good. Certainly easy to use and (I’d say) well documented, and creates some pretty nice looking plots with very little effort. I’m sure there are better or more commonly used options but it did the job (aside from the automatic scaling options not really seeming to work – though I figured my own way around that and have an idea on how to implement auto-scaling properly when I extend the app further).
What’s Next?
- Make a more finished app (I have a bunch of feature ideas in the Github repo)
- Add to the Play store
- Optimise the operation for large numbers of trials (avoid any unnecessary recalculation of math that is the same in each trial, for one thing)
- Use my new skills to complete my GetTogether app idea, which will certainly be a more advanced project.
